25 Aug 2026
Track Temperature Swings Reshaping Qualifying Line Values Across Formula One Venues
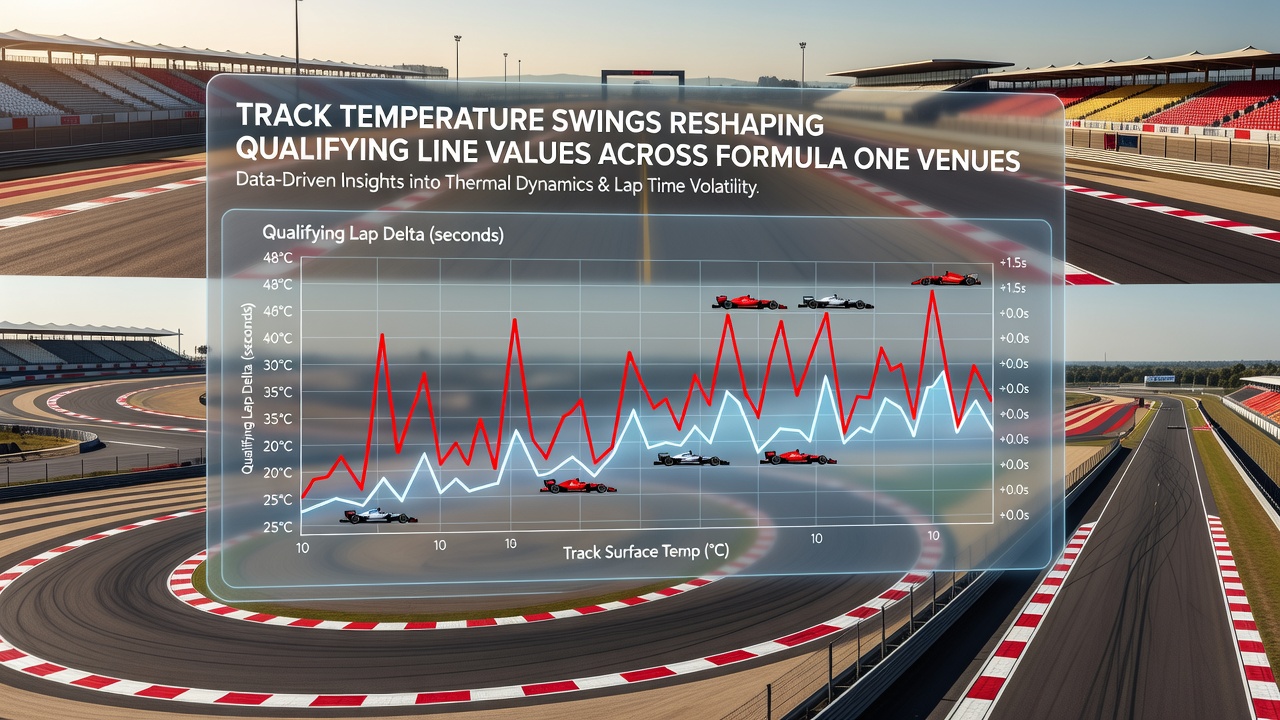
Track temperature fluctuations have begun to exert measurable influence on qualifying session outcomes and the associated line values that bookmakers establish for Formula One events. Data collected across multiple circuits shows that asphalt heat retention patterns create distinct performance windows during Saturday sessions, and these windows shift lap times by measurable margins that directly affect odds structures. Observers note that teams now calibrate tire preparation routines around real-time surface readings rather than air temperature alone, which alters the reliability of historical benchmarks that markets once relied upon for setting initial lines.
Measurement Standards and Data Collection Practices
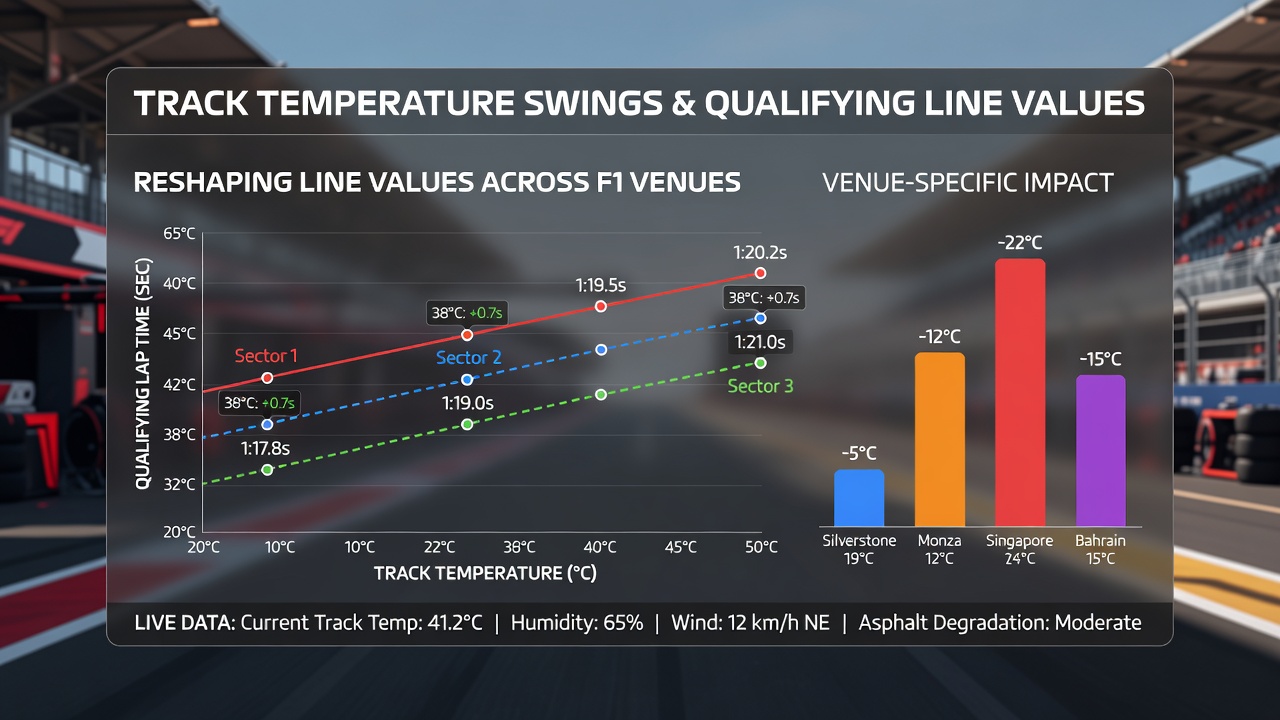
Formula One timing systems record track surface temperatures at multiple points around each circuit, and these readings feed into tire management models that teams use to predict grip levels. Research indicates that a 5-degree Celsius rise in track temperature can reduce lap times by up to three-tenths of a second on certain layouts when rubber compounds reach optimal operating ranges. Figures from the 2025 season reveal that venues with darker asphalt surfaces experience faster heat buildup during morning qualifying runs, whereas lighter-colored tracks retain warmth longer into evening sessions. Those who analyze telemetry data across seasons have documented how these patterns force rapid adjustments in setup choices that influence sector times and ultimately the final grid order.
Venue-Specific Responses to Temperature Swings
Circuits such as Singapore and Monaco demonstrate pronounced sensitivity because their urban environments trap heat differently than open-air layouts. In contrast, desert-based tracks like Bahrain and Saudi Arabia show extreme daily swings that compress the usable performance window for qualifying tires. Studies compiled by motorsport engineering groups show that these locations produce larger deviations between expected and actual lap times when ambient conditions change overnight. Teams that monitor infrared mapping tools gain advantages in predicting when a track will cool enough to allow fresher rubber to deliver peak grip, and these timing decisions feed directly into the probability calculations that determine qualifying head-to-head lines.
Impact on Line Construction and Market Adjustments
Bookmakers have incorporated dynamic temperature forecasts into their models because static historical averages no longer capture the variance introduced by modern climate patterns. Data from European circuits during the 2026 campaign shows that qualifying lines for top-ten finishers moved by an average of 12 percent when track temperatures deviated more than four degrees from seasonal norms. Markets now receive updates closer to session start times, and these revisions reflect real-time asphalt readings rather than pre-event projections alone. Those who track line movement across platforms observe that sharper adjustments occur at venues where temperature swings exceed typical ranges, forcing oddsmakers to widen spreads to account for increased uncertainty in grid predictions.
August 2026 Observations Across Multiple Events
During the August portion of the 2026 calendar, several European rounds recorded unusual temperature drops between practice and qualifying that shifted expected orderings. At one venue, overnight cooling produced a track surface six degrees colder than the previous day, which extended the time required for tires to reach working temperature and altered the order of drivers in the final segment. Reports compiled by timing service providers confirm that these conditions prompted teams to alter warm-up lap strategies, and the resulting performance changes affected multiple head-to-head matchups that markets had priced earlier in the week. Observers tracking these sessions noted that line values for midfield runners experienced the largest revisions because their tire management margins proved more sensitive to surface conditions than those of front-running squads.
Technological Tools Driving Updated Forecasts
Advanced modeling software now integrates satellite-derived surface temperature data with on-track sensor feeds to generate session-specific predictions. Engineers at several squads have developed algorithms that translate expected heat retention into projected lap time deltas, and these projections influence both strategy calls and the probability inputs used by betting platforms. Academic research groups studying polymer behavior in high-performance tires have contributed findings that link compound response curves to precise temperature thresholds, allowing more accurate simulation of qualifying runs under fluctuating conditions. The integration of these tools has reduced the lag between observed weather changes and updated line values across major operators.
Regional Variations and Long-Term Patterns
Analysis of circuits in different climate zones reveals that tropical venues experience smaller but more frequent temperature oscillations during race weekends, whereas continental locations show larger but more predictable swings tied to frontal systems. Data aggregated over five seasons demonstrates that these regional differences produce distinct volatility signatures in qualifying results, which markets have begun to price through venue-specific adjustments rather than blanket formulas. Teams that travel with portable weather stations gain granular readings that supplement official FIA measurements, and this additional information helps refine predictions for how quickly a cooling track will drop out of the optimal grip window.
Conclusion
Track temperature swings continue to reshape the inputs that determine qualifying line values at Formula One venues worldwide. Measurement improvements, venue-specific thermal behaviors, and refined forecasting tools have combined to make historical averages less reliable for establishing initial odds. As data collection expands and modeling techniques advance, markets adjust their frameworks to accommodate the performance variability that surface heat fluctuations introduce. The patterns observed through August 2026 underscore how these environmental factors now form a core component of session analysis rather than a secondary consideration.