25 Aug 2026
Relief Pitcher Workload Patterns Shaping Live MLB Betting Decisions
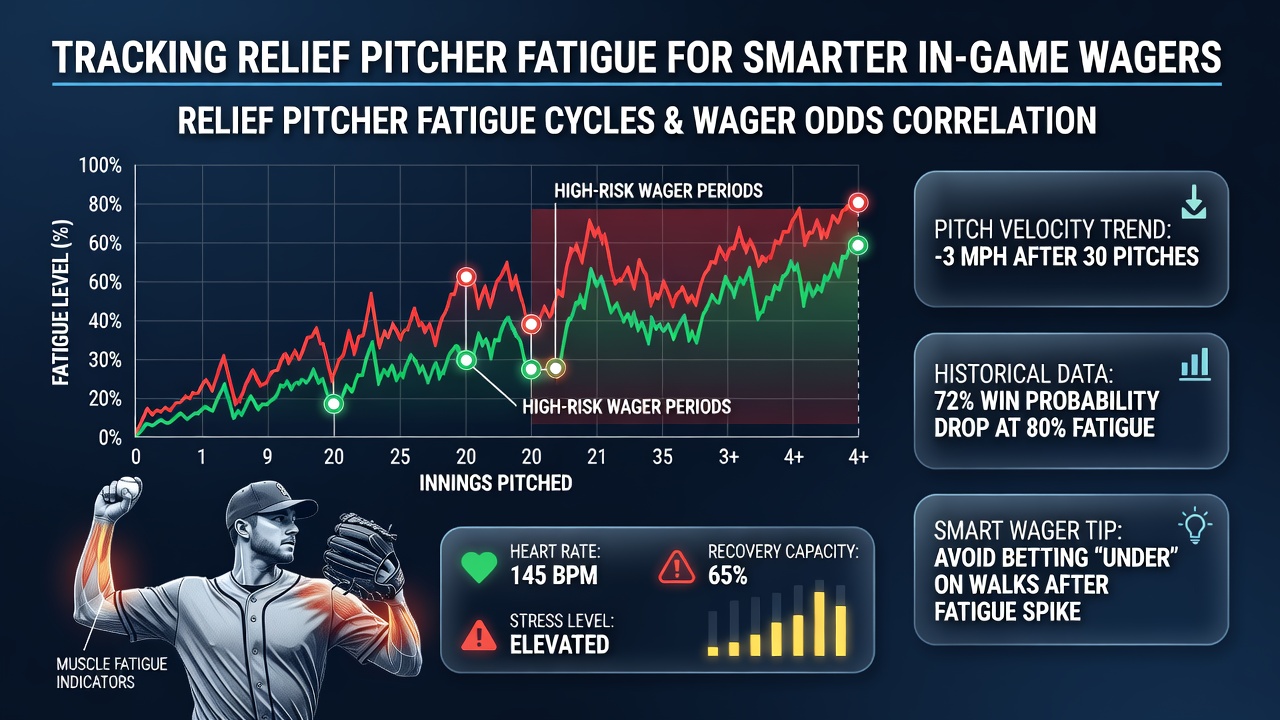
Relief pitchers in Major League Baseball operate within distinct workload cycles that influence their effectiveness during extended appearances, and observers note how these patterns provide measurable signals for in-game wagering adjustments. Teams deploy relievers in high-leverage situations where cumulative pitch counts, velocity maintenance, and recovery intervals between outings determine performance consistency, while data from recent seasons shows that fatigue often manifests after specific thresholds are crossed. Analysts track these elements because bullpen usage spikes during August 2026 stretch runs when playoff positioning intensifies and managers lean on familiar arms repeatedly.
Core Components of Fatigue Tracking Systems
Velocity decline serves as one primary indicator, with studies from the Society for American Baseball Research showing average fastball speed drops of 1.5 to 2.5 miles per hour after 25 pitches in a single outing for many middle relievers. Pitchers who maintain velocity longer tend to preserve strikeout rates, whereas those exhibiting early drops see walk rates climb and contact quality improve for opposing hitters. Recovery time between appearances adds another layer, since relievers with fewer than two full days of rest post a higher earned run average in follow-up games according to aggregated league data.
Workload distribution across the week further refines these models, and researchers have documented how consecutive days of usage compound effects even when individual pitch totals remain moderate. Teams that cycle through multiple relievers in quick succession create windows where specific arms become vulnerable, yet bettors who monitor real-time pitch counts and velocity feeds gain edges by identifying these transitions before lines adjust.
Integrating Metrics into Live Wagering Frameworks
Live betting markets on run totals and next-inning outcomes respond to observable fatigue signals once a reliever surpasses established pitch thresholds, and operators update odds accordingly when velocity readings or strike percentage trends shift noticeably. Bettors combine pitch-tracking technology outputs with historical performance splits to project whether a current arm will record outs efficiently or yield hard contact. This approach proves especially relevant during August 2026 when schedule density increases and bullpens face repeated high-pressure demands without adequate rest cycles.
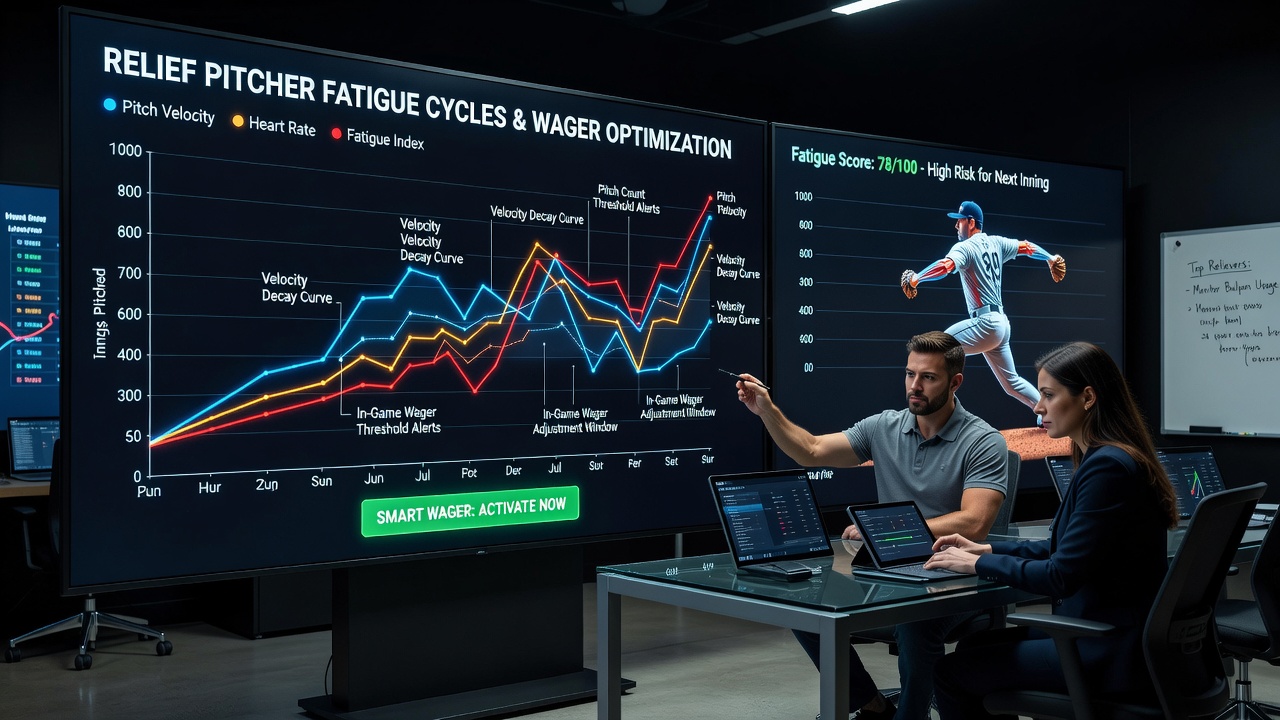
One analytical method involves cross-referencing current outing data against a pitcher's seasonal baseline, allowing identification of deviation points where effectiveness typically wanes. For instance, arms that normally sustain 95-plus mile per hour fastballs but dip below 93 miles per hour after 18 pitches often allow elevated slugging percentages in ensuing at-bats. Such patterns appear consistently across divisional play where familiar lineups exploit these declines quickly.
Seasonal Context and Data Application Examples
August schedules introduce additional variables because travel demands and consecutive game stretches limit recovery opportunities, leading to accelerated fatigue accumulation in certain reliever roles. League-wide statistics reveal that relievers logging over 30 pitches in an appearance followed by another outing within 48 hours post elevated walk rates in the second game. Bettors who layer these historical tendencies onto live pitch count feeds refine their assessments of whether an over or under on total runs holds greater probability as innings progress.
Industry reports from sources like Baseball Prospectus further highlight how specific pitch types, such as sliders and curveballs, lose movement and command faster than fastballs under fatigue, creating exploitable contact patterns. Teams facing opponents with strong opposite-handed hitters benefit when the opposing manager deploys a fatigued reliever, and this matchup information integrates directly into live wager evaluations.
Conclusion
Systematic monitoring of relief pitcher fatigue cycles supplies objective inputs that inform timing and selection of in-game baseball wagers across various markets. Velocity trends, pitch accumulation, recovery intervals, and historical splits combine to generate actionable signals that evolve with each appearance. As August 2026 unfolds and bullpen demands intensify, these tracking methods continue to align with observable performance shifts that affect live odds across platforms.