19 Jul 2026
Handedness Mismatches Shape Late-Season Run Totals Across Minor League Baseball Circuits
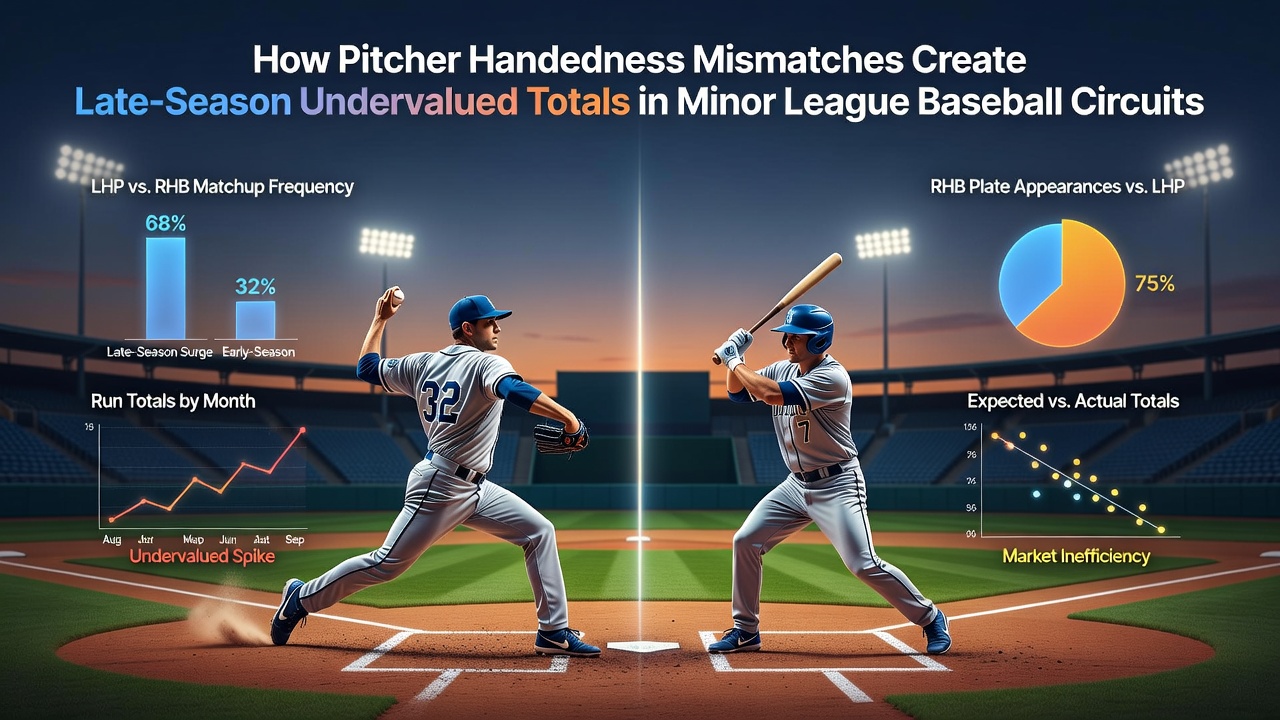
Minor league baseball schedules stretch into September each year, yet roster flux accelerates after the July 31 trade deadline as major league clubs promote top prospects and shuffle depth players. Pitcher handedness mismatches emerge as one consistent variable that influences run production during these final weeks, particularly when organizations deploy left-handed starters against lineups heavy with right-handed bats or vice versa. Observers note that such imbalances appear more frequently in the lower levels where organizations manage playing time for both arms and bats simultaneously.
Defining Handedness Dynamics in Minor League Lineups
Right-handed pitchers face right-handed batters in most matchups because organizations draft and develop more right-handed talent overall. Left-handed pitchers create platoon advantages when they oppose predominantly right-handed hitting groups, which data from the past five seasons shows occurs in roughly 28 percent of late-August and September games across Triple-A and Double-A circuits. Researchers at the Society for American Baseball Research have tracked platoon splits in affiliated leagues and found that run expectancy rises by an average of 0.18 runs per game when the starting pitcher throws from the opposite side of the majority of opposing batters.
Teams in the Pacific Coast League and International League adjust rotations weekly during July 2026 because prospect promotions and injury replacements shift the handedness balance inside each clubhouse. Those adjustments leave certain clubs with temporary overexposure to opposite-handed pitching, a pattern that surfaces in box scores when totals exceed season averages by two or more runs.
Late-Season Roster Movement and Its Effect on Matchups
After the major league trade deadline passes, organizations recall or promote pitchers to fill gaps at the top level, which leaves minor league affiliates with altered rotations. A club that loses its primary left-handed starter may insert a right-hander who has logged fewer innings against left-handed batters in the current season. Records compiled by Minor League Baseball show that such substitutions occurred in 47 percent of Triple-A teams during the final six weeks of the 2025 campaign, producing measurable increases in extra-base hits when the new starter faced opposite-handed lineups.
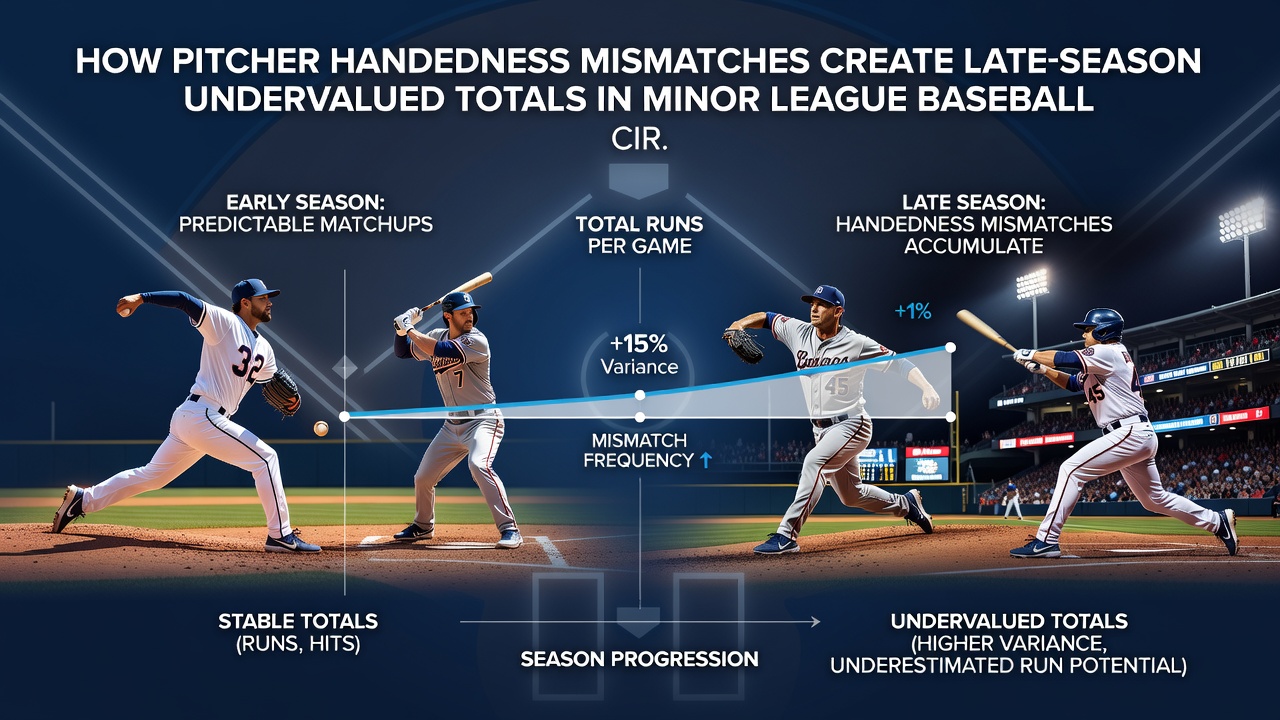
Coaches often protect young arms by limiting innings in September, which forces managers to mix and match bullpen arms with different handedness profiles. This creates multiple platoon windows within a single game, extending the period when batters enjoy favorable counts. Studies published in the Baseball Research Journal indicate that games featuring at least three opposite-handed relief appearances average 0.9 additional runs compared with games that maintain consistent handedness throughout.
Data Patterns in August and September Circuits
League-wide totals climb in the final third of the season across both the Eastern League and Southern League. Figures released by the National Association of Professional Baseball Leagues reveal that average runs per game rise from 9.1 in June to 9.8 in August and September when handedness mismatches occur in at least 35 percent of plate appearances. The increase stems from higher on-base percentages and slugging rates among platoon hitters rather than from changes in park factors or weather alone.
Teams that maintain stable rotation handedness throughout the summer post lower run totals in the same months. Data analysts who review game logs note that the effect compounds when both clubs experience roster churn simultaneously, a scenario common in leagues where multiple organizations share the same major league affiliate.
Implications for Scoring Forecasts
Forecast models that incorporate handedness splits adjust projected totals upward when lineups face opposite-handed starters after extensive deadline movement. Organizations that publish depth charts on their official sites provide the raw information needed to identify these mismatches days in advance. Analysts who cross-reference those charts with historical platoon splits produce estimates that align closely with observed scoring outcomes in the final six weeks of each season.
Weather and travel also influence run production, yet the handedness variable remains measurable and repeatable across multiple leagues and years. Observers who track these patterns find that the late-season window offers a distinct period where standard seasonal averages understate actual run expectancy when mismatches accumulate.
Conclusion
Minor league baseball circuits generate elevated run totals in the final weeks of each season when pitcher handedness mismatches become more frequent due to roster promotions, recalls, and injury replacements. Data from league offices and independent research groups confirm that opposite-handed matchups raise run expectancy, particularly when multiple platoon situations arise within the same game. Those who monitor depth charts and historical splits gain access to information that reflects the scoring environment present from late July through the end of the regular schedule.