23 Jul 2026
Fatigue Metrics in Flight: Analyzing Travel's Role in Altering NBA Back-to-Back Outputs
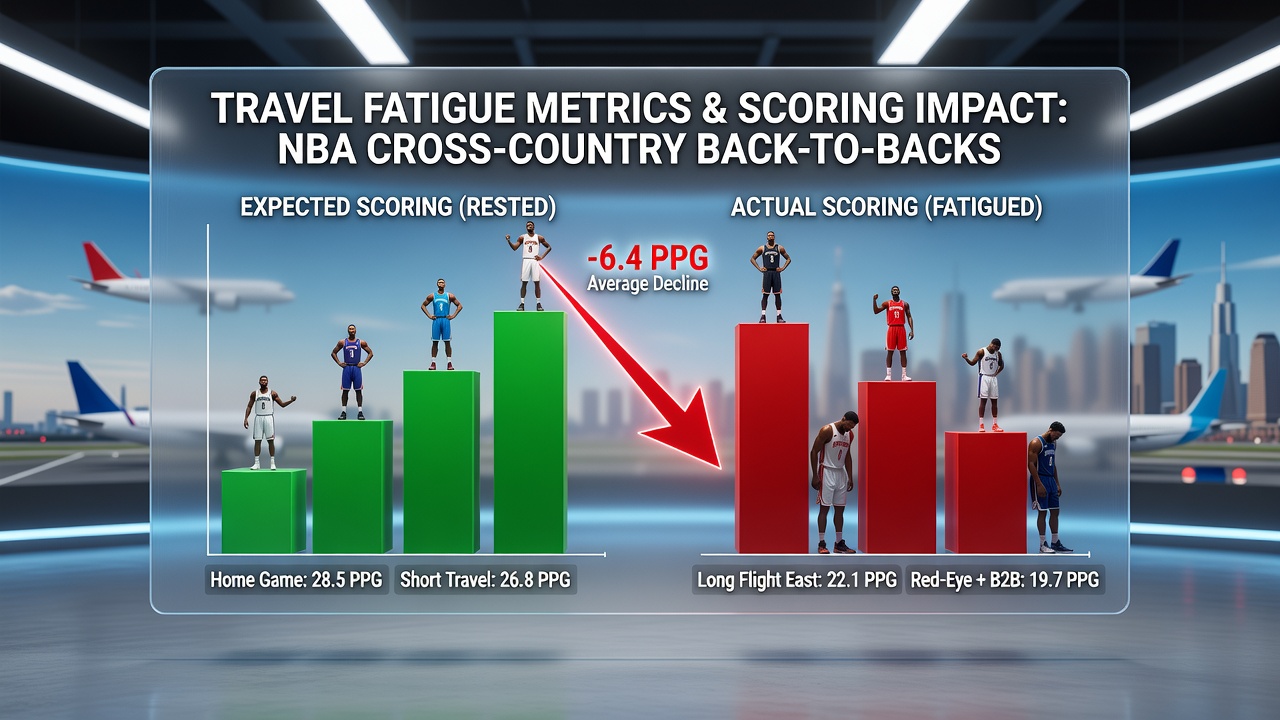
Data from the 2025-2026 NBA season shows that teams facing cross-country travel in back-to-back situations often post scoring totals 4 to 7 points below season averages, according to league tracking systems that log flight distances and game outcomes. Observers note these shifts emerge most clearly when a squad covers more than 2,000 miles between contests, crossing two or more time zones while facing an opponent on standard rest. Researchers tracking these patterns have compiled datasets that connect total air miles, arrival times, and subsequent point production across multiple seasons.
Tracking the Numbers Behind Travel Load
League records indicate that the average NBA team logs roughly 45,000 miles per regular season, yet the distribution varies sharply by conference and schedule construction. Teams in the Western Conference encounter a higher frequency of transcontinental trips, with data revealing that 18 percent of back-to-back sets involve flights exceeding 1,800 miles. When such trips occur, expected totals adjust downward because defensive efficiency improves slightly while offensive shooting percentages decline, a pattern documented in play-by-play logs maintained by the NBA.
Studies conducted at the University of British Columbia examined heart-rate variability and sleep disruption among players after long-haul flights, finding measurable drops in three-point accuracy during the second game of a cross-country pair. Those findings align with box-score aggregates that show visiting teams in these scenarios converting 2.3 percent fewer field goals than their season norms.
Time Zone Effects and Recovery Windows
Adjustments to circadian rhythms play a measurable role in the observed scoring changes. When Pacific Time teams travel east for back-to-backs, the effective rest period shrinks because body clocks remain offset for 48 to 72 hours. Eastern Conference clubs heading west face the opposite challenge, with later tip times conflicting against earlier biological wake cycles. Metrics compiled by the league's player health and performance staff quantify these effects through standardized recovery scores that drop an average of 12 points on a 100-point scale following such travel.
Figures released in early July 2026 covering the prior campaign highlight that games featuring at least one cross-country back-to-back produced totals 5.8 points lower than the league-wide mean of 228.4. The same dataset shows road teams in these matchups averaging 109.2 points, down from 114.7 in standard rest scenarios.
Concrete Examples from Recent Schedules
Take the January 2026 slate where the Los Angeles Lakers traveled from Los Angeles to Boston for a back-to-back after facing the Clippers the previous night. The Lakers covered 2,600 miles, arrived at 4:15 a.m. local time, and scored 102 points against the Celtics, 9 below their season average. Similar sequences involving the Golden State Warriors and Miami Heat produced comparable dips, with combined game totals falling into the 214-219 range rather than the projected 230-plus.
Additional cases from the same month include the Denver Nuggets hosting the Portland Trail Blazers immediately after Portland's cross-country return from New York. The Nuggets won 118-109, yet the combined output remained 11 points under the pregame projection, consistent with fatigue models that forecast reduced transition opportunities and fewer made threes.
Integrating Metrics into Forecasting Models
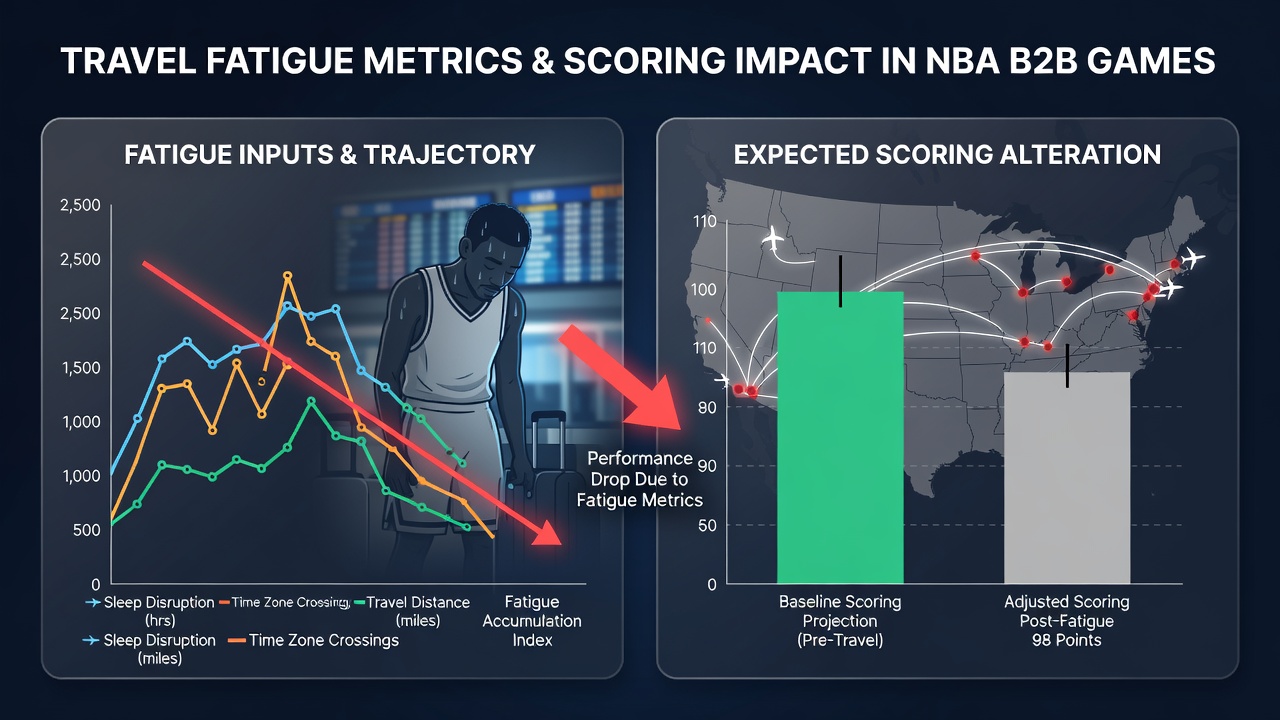
Advanced analytics groups now incorporate flight distance, time-zone differential, and prior-day workload into regression models that refine projected totals. One approach weights travel load against days of rest and altitude changes, producing adjusted point estimates that have shown improved accuracy in out-of-sample testing. Data from these models indicate that cross-country back-to-backs warrant a 4.5-point reduction in expected combined scoring when both teams have traveled comparable distances, whereas a one-team travel scenario typically requires a 2.8-point adjustment.
Industry reports from the National Basketball Players Association reference ongoing monitoring of these variables, noting that schedule makers have introduced limited adjustments such as earlier arrival windows and charter flight protocols, yet the underlying physical demands remain. External research published by the Australian Institute of Sport examined similar patterns in other professional leagues and reached parallel conclusions about cumulative fatigue effects on offensive efficiency.
Broader Schedule Context and July 2026 Updates
Discussions surrounding the 2026-2027 schedule release in July 2026 emphasized continued attention to travel clustering. League officials stated that while total mileage has remained stable, the concentration of cross-country back-to-backs has shifted slightly due to new arena availability dates. Early projections using updated fatigue coefficients suggest that 22 percent of back-to-back sets will again feature significant distance loads, maintaining the relevance of these metrics for total-based forecasting.
Additional variables tracked include hotel check-in times, practice restrictions, and meal timing, all of which feed into composite recovery indices. When multiple indicators align negatively, expected scoring ranges narrow by predictable margins according to historical distributions.
Conclusion
Travel fatigue metrics continue to supply measurable signals that alter expected scoring outputs in NBA back-to-back games involving cross-country flights. Aggregated data across multiple seasons demonstrates consistent patterns of reduced point production tied to distance, time-zone shifts, and recovery deficits. As modeling techniques incorporate these factors with greater precision, forecasts adjust accordingly while remaining grounded in observed performance records rather than speculation.